Ever wonder what would happen if water levels rise 3, 4, even 10 feet in Charleston? Sea for yourself with this sea level map developed by Climate Central showing “Land Below X Feet of Water.” Toggle the water level button to the right or left to choose an elevation above the high tide line — which could be reached through a mix of sea level rise, tides, and storm surge. The red zones on the map indicate land areas below water level.
Charleston below 3 feet of water

Land below 3.0 feet of water | via Climate Central
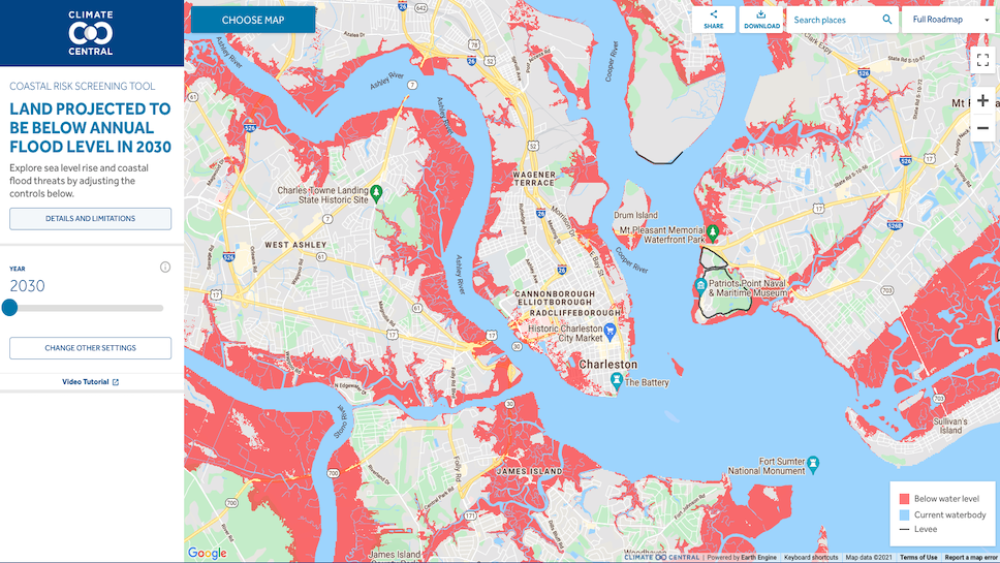
You can also see the future of Charleston’s coastlines. Check out this flood map of “Land Projected to be Below Annual Flood Level’’ + select the year. Navigate local sea level rise and coastal flood threats in 2030, 2050, and beyond.
Charleston projected flooding in 2030

Land projected to be below annual flood level in 2030 | via Climate Central
Live inland? You might have waterfront views before you know it.
Keep in mind — these maps include some error + should be used as screening tools for areas that could be at risk. 🌊


